Introduction to Simulation: Beginner
Lab Report
-- Coming soon --Lab Report
Individual Report Due date: 15 March 2025 (Saturday), 23:59 Include: Code, figures, and anything you think it is important :) Submit: PDF file only to Blackboard email: ningg.han@connect.polyu.hk (Han Ning) Kind Remind: Do not use GPT or other LLMs to solve these problems or they will misslead you, and we have already tried.Question 1
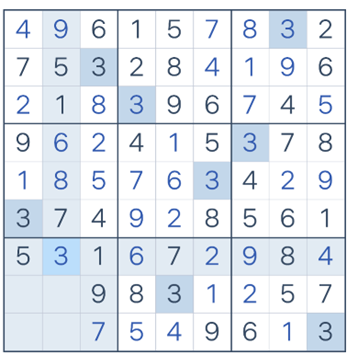
Look at the following sudoku problem and use for loop and if - else to calculate the remaining four blanks.(Hint:
Firstly, check which four numbers left in the nine-square grid in the lower left corner, then calculate the sum
of the first two columns and the last two rows.)
Question 2
Use the plot function to draw the solution of the maze and use the scatter function to mark the
starting and the ending points of the solution with different colors. (You do not need to draw the maze.)

Question 3
"Every 7 must pass" is a small game in mainland China. Many people take turns to count from 1. When they encounter a number that contains 7 (17, 71) or a number that is divisible by 7 (14, 21), they say "pass". Please write a matlab program that only uses IF-ELSE, FOR loops and numerical operations to solve the numbers that need to be passed within 150.
Question 4
Assume this is the way Professor David gives you final score
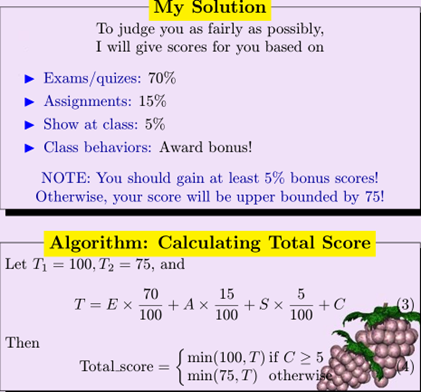
- What will be your final score if you obtain E = 80, A = 92, S = 80 and C = 4.
- If you only obtain E = 22, A = 30 and S = 0, how many award bonus do you need to help you pass this course.